In a world that is all about “what happened two minutes ago”, the Olympics represent a once-every-four-year touchstone on what really has changed in the world.
Although Beijing 2008 (remember that crazy lit-up swimming pool) and London 2012 (I seem to recall sprinter Usain Bolt’s successful defence and Danny Boyle’s impressive opening ceremony) are faded memories, they are 1461-day mileposts in many sporting fields. I thought i would reprise an analysis I did back in 2012 and look at what Olympian levels of change have happened over the last 8 years in the technology track and digital field.
Sources- Internet Live Stats, Cisco, Counterpoint Stats, Statista, Facebook, Twitter, Ericsson, ATOS
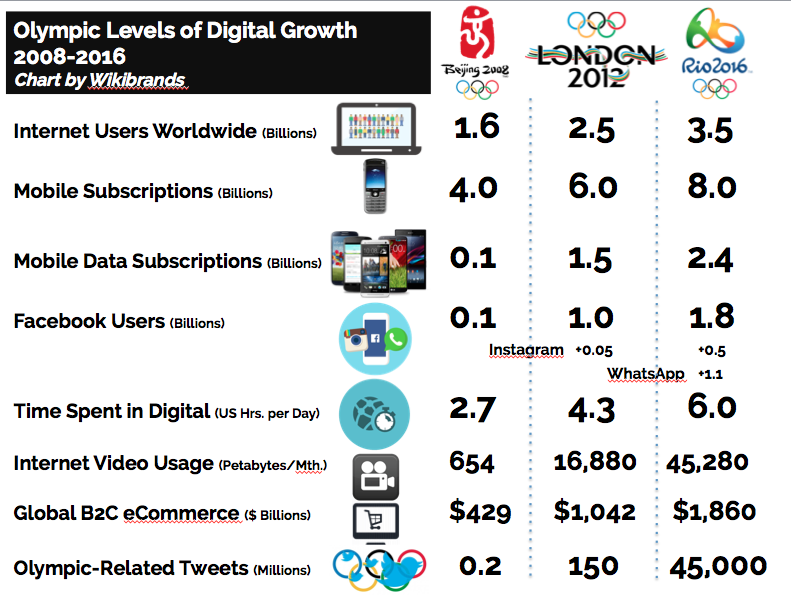
We looked at 8 different statistical weather vanes that we think best represent the state of growth in the digital universe.
- Internet Users Worldwide Growth
The growth in interest users is reaching a tipping point as they will represent close to half the world’s population (~46%) in 2016, and double what tit was 8 years ago. That’s pretty hefty given that the internet universe was a precocious 1% of the world’s population back in 1995. It will be interesting to see the trajectory of the internet and what companies focus on as internet population growth has slowed on an annual basis from 14.7% in 2008 to 7.5% in 2016. Will be still care about the developing worlds and getting the next 3-4 billion online through balloons, drones, cheaper devices and free internet? Or will we consider squeezing that juice out of the orange too hard and focus instead on enhancing the web for people already attached and drive better experiences and for companies the nirvana ARPU (average revenue per user)?
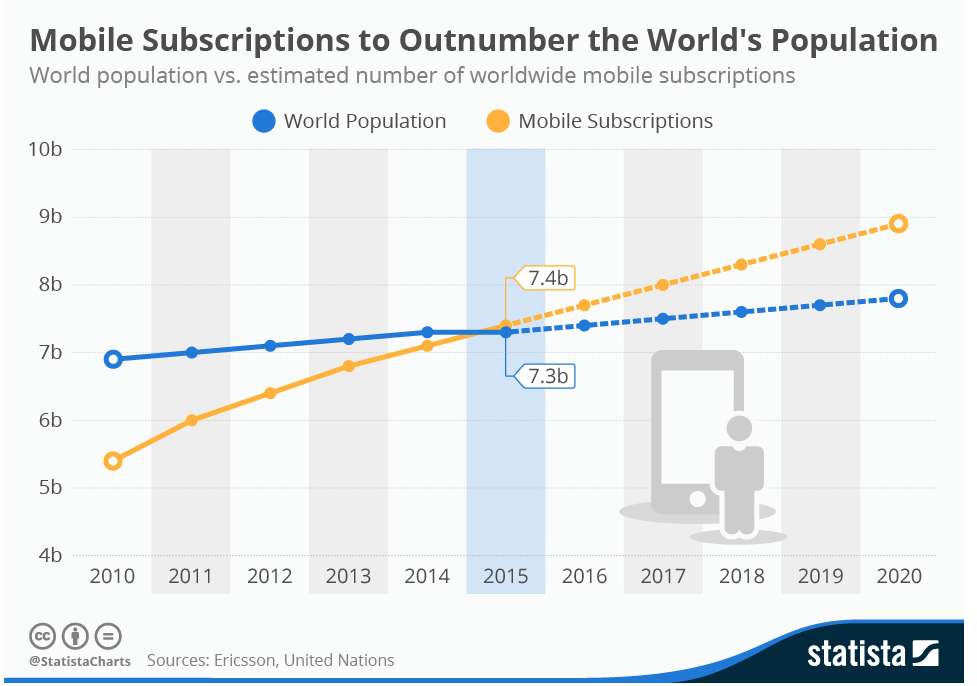
2. Mobile Subscriptions
2015 represented an interesting year for mobile in that there are now more mobile subscriptions than there are people in the world. That doesn’t mean everybody is connected, some of us have more than one way to connect (about 1.47 subscriptions per connected user). But we are reaching saturation point. The growth engine may be in connected devices. When we include the internet of Things and connected homes, cars, wearable and TVs. it is expected we will move 1 connected device per person in 2008, to 2 in 2012, to 4 in 2016 and nearly 7 in 2020.
Some interesting prospects exist in developing world nation where in places like Kenya the majority of the population owns a mobile phone to perform life’s essential services even though only 25% own a physical, real venue bank account.
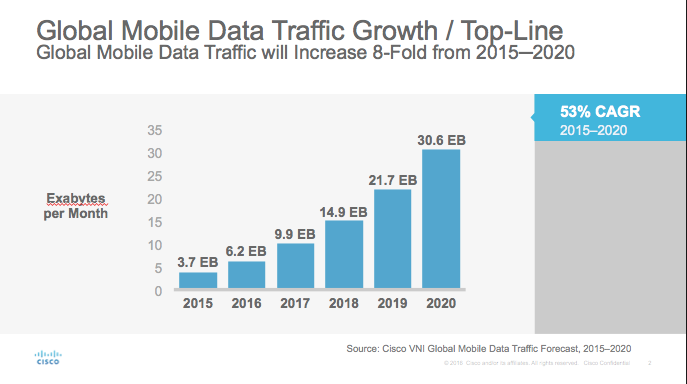
3. Mobile Data Subscriptions
Taking a global view, we have barely scratched the surface on what we can do with the smarter version of mobile – location aware, personal sensing, app-driven smartphones. Although we have experienced 24X growth over the last 8 years of more sophisticated smartphones and mobile PCs, that will be another 2.5X growth over the next 4 years. And it’s not only the number of people, but it’s also what we’re doing on our devices, enhanced need for data-rich infrastructure and our growing dependence on them.
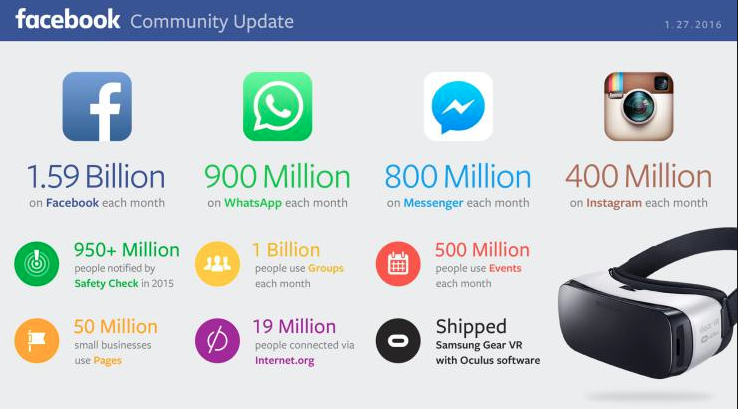
4. Facebook Users
Facebook had barely emerged from Mark Zuckerberg’s Harvard dorm room and in the shadow on ill-fated MySpace back in 2008. In fact, you couldn’t even Like things on Facebook until 2009. By summer 2016, It will have experienced 19X growth between the Beijing games and the Rio ones. It is less a social website now and more social ecosystem with flanges all over the place, competing against Google, Apple and Amazon for your life needs. And just when you thought, Facebook could lose its way and maybe become irrelevant, they decided to gobble up and grow billions of other new people and connections on platforms like Instagram which is bought in 2012 and WhatsApp in 2014, never mind it’s investment with millions of other users on a standalone FB Messenger and now Oculus Rift in 2016.
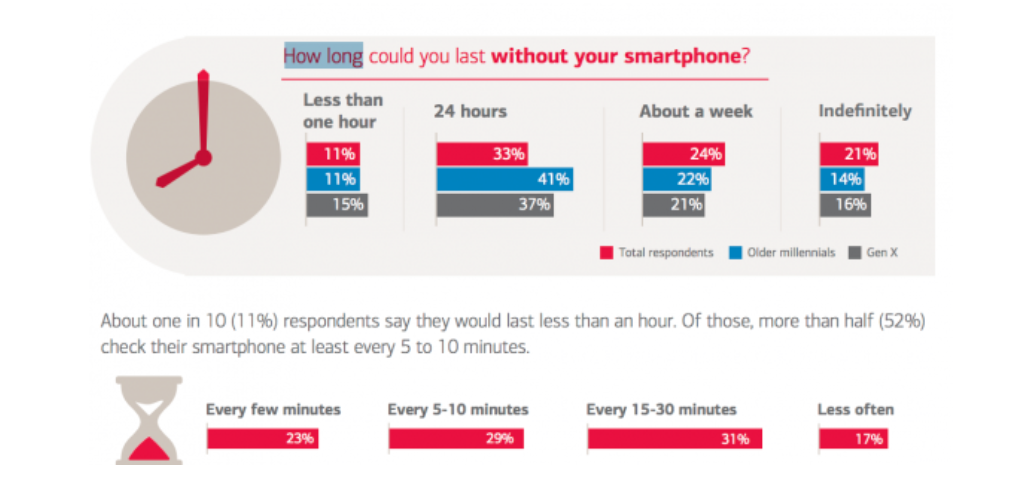
5. Time Spent in Digital
Much to family, classroom and company discord, we are slowly becoming addicted to devices. The US media consumption trend reflects the world more broadly with our inability to stay away form our screens. When watching the Olympics in Rio, we will spend 2.3X more time per day in digital media then we did while watching Beijing – that;’s about 6 hours each day!. And we will do it anywhere. Back in 2008, we spent 11% of our digital time in mobile, now we will be spending 50-60% of our digital time in mobile. Remember when addictions were smoking, gaming or sole a young people arena? Think again.
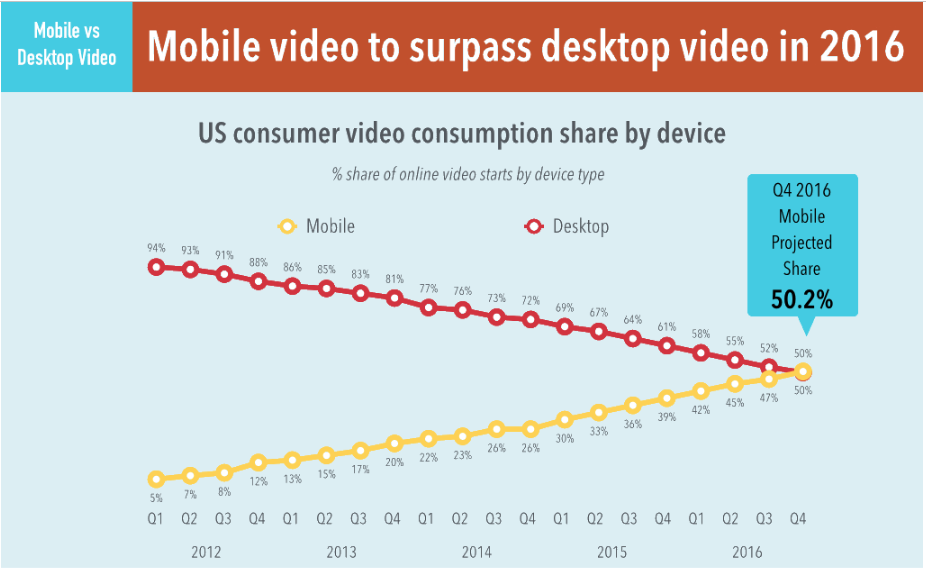
6. Video Usage
We will be watching 69X more video than we did in Beijing 8 years ago. That’s more Netflix. That’s more Facebook Video. More YouTube. More Meerkat/Periscope. And I’m sure a tonne of other niche video channels. Fully 60% of internet traffic will be video this year. And mobile video views are up a whopping 844% since 2012. the desktop is becoming less and less relevant for even the bandwidth hogger – video – in 2016.
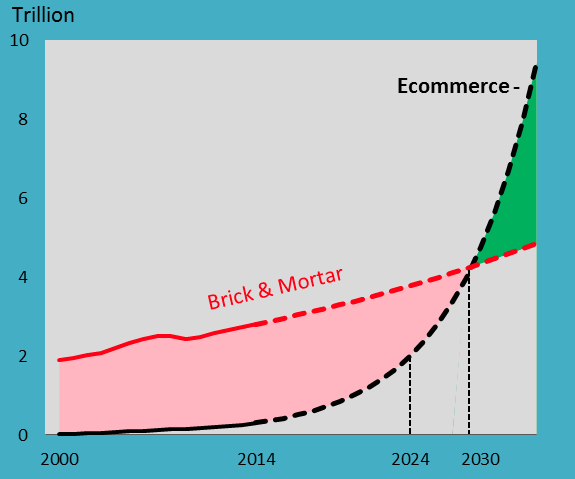
7. eCommerce/mCommerce
There is 4.3X more stuff being bought online in 2016 then 8 years ago. That may seem like a disappointment vs. other parts of the burgeoning web, but it does factor in the slower adoption of customers due to a variety of factors – preference of brick and mortar, trust/security issues, quickness of fulfillment/delivery/returns obstacles and spotty customer service. As internet commerce retailers figure this out, you will see a longer term tipping point. As US brick and mortar commerce is growing at 2.8% and internet-enabled commerce growing at 18.7% annually, we will see those two lines cross by 2030 – only 3 more Olympics away.
8. Olympic-Sized tweets
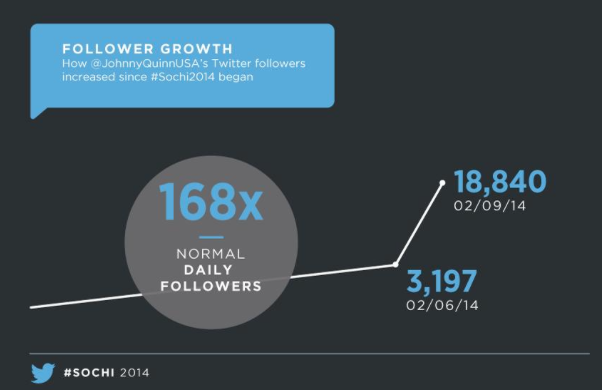
A full forensics on digital growth wouldn’t be complete without speaking to the amount of Tweets this summer we’ll peruse about the Rio Olympics. As much as Twitter has had its well publicized struggles on user and revenue growth, there will be 225,000X more tweets about #Rio2016 than there was about Beijing. Part of that is a function of the fact there were only 6 million users and only a handful of athletes back in 2008, 150 million in 2012 and now 350 million estimated Tweeters in 2016. Heck the hashtag wasn’t even invented until 2007! As can be seen by American bobsledder’s Johnny Quinn’s gold medal Sochi twitter performance, niche athlete can become front page headline if you play your cards and tweets right. they will all be on in 2016.