Jun 27, 2016 | Branded Content and Social Business, Culture & Leadership, Front Page, Hot Topics, Leading Winning Business, WHAT'S NEW
I’ve been thinking a lot about presentations lately. In the course of a year, i’ll have the opportunity to impact over 10,000 people in a live presentation arena and plenty more online. Like any craft, it’s my obligation to stay abreast of what works.
Two prevailing axioms that I have always found inescapable and I try to combine in my presentation work:
- Yes, it is a performance (the sizzle) – a presentation needs to entertain, take people on a ride, embed key messages within a narrative, treat people’s time as valuable and cater to the human need for sensorial stimulation in order for messages to sink in; too many corporate execs deny this reality or simply aren’t comfortable bringing the circus to town. Yawnnnn….
- It needs to have a goal that is helpful and has lasting value for the audience (the steak) – what’s the point if you’re not inspiring, educating or teaching your audience something relevant, new and practical; too many speakers on the professional circuit miss this mark in pursuit of the personal ego stroke, promotion of their own nirvana world views or worse, laziness in not customizing their content for their audiences. Remember the presentation is for them, not you.
So what else am I thinking about the art and science of “the prez”?:
- How is technology changing the idea of presentations?
- What formats make for the best presentations?
- Do audiences react differently to different presentations?
- If we are truly into “engagement”, are “people on stage” the best vehicles for that?
- How do I get to generate an even better reaction with my key stakeholders “the audience” before selfishly addressing my own objectives ?
Most of the dogmatic wisdom I hear about presentations comes from the professional presenter clique themselves. Make no mistake, they give good slide. I’ve provided examples of my five best presentation sources of inspiration below.
But what seems more annoyingly now more than ever, is the sameness of the well-coiffed school of slide-ology (and yes, that is a word). Conferences are spitting out highly-opinionated and rehearsed orators, they all are using the 60-90 slide, awesome background shots with one sentence prophetic statements, TED-like mantras (admission I do love TED but it’s not everybody’s thing) and “Look at me, look at me” delivery styles.
Is this what we want? Are other people seeing this trend toward style over substance? Quality of visual over thinking? Narcissism over selflessness? Noble-minded opinion over well-articulated theory put into practice?
So I searched for something that these presentation touring band hands would be wise to consider – evidence!
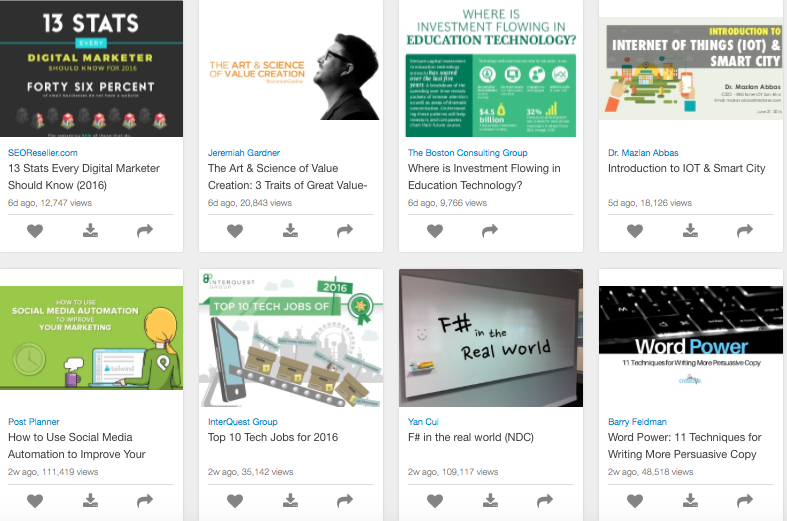
In looking at the last 30 most popular and recently popular presentations on Slideshare (I am making the presumption that a well viewed Slideshare presentation makes equally good live performance fodder). I found some interesting grains of truth. First of all, contrary to the speaker code, I noticed a large range of formats and styles amongst these viral slide hits (no dogs in the bunch – average views for these recently uploaded decks were 14k per day).
First, the quantitative stats on top presentations :
Number of slides: Average length – 57 slides, Range 16 to 147 – Verdict: no direct link to quantity of views/shares Conclusion – there is no rule of thumb for slide length
Number of words on slide: Average words/slides – 27 words, Range 2 to 153 – Verdict: no direct link to quantity of views/shares Conclusion – there is no rule of thumb for words on slide
Quality of Graphics: 8 presentations had truly great, likely professionally done slide work, 5 had good impactfully done slidework likely pulled together by the presenter themselves and 7 had very average looking slides (using available Powerpoint templated formats) – Verdict – although it helps and led to more social sharing, there is no standard floor for graphics in presentation impacting views or potential distribution Conclusion – spend less time developing great graphic and more time developing great ideas, provocations, arguments, evidence and results.
Number of Shares: the average amount of shared activities per presentation each day on the four relevant social networks (Facebook, Twitter, LinkedIn, Google+) was 11 per day with a range of 1 to 158 Verdict: the only key skews being towards more emotional presentations (+88% shares vs. average) and higher quality of slide graphics (+49% shares vs. average) Conclusion: no golden rule for getting social sharing of your content, communicate humanly, clearly and desirably and you have a chance.
So if we can’t rely on these numerical rules, what did they all have qualitatively in common?
– A Central Idea – at the heart of what was being presented, there was a solid idea on what was being covered, even better communicated when in the title of the presentation.
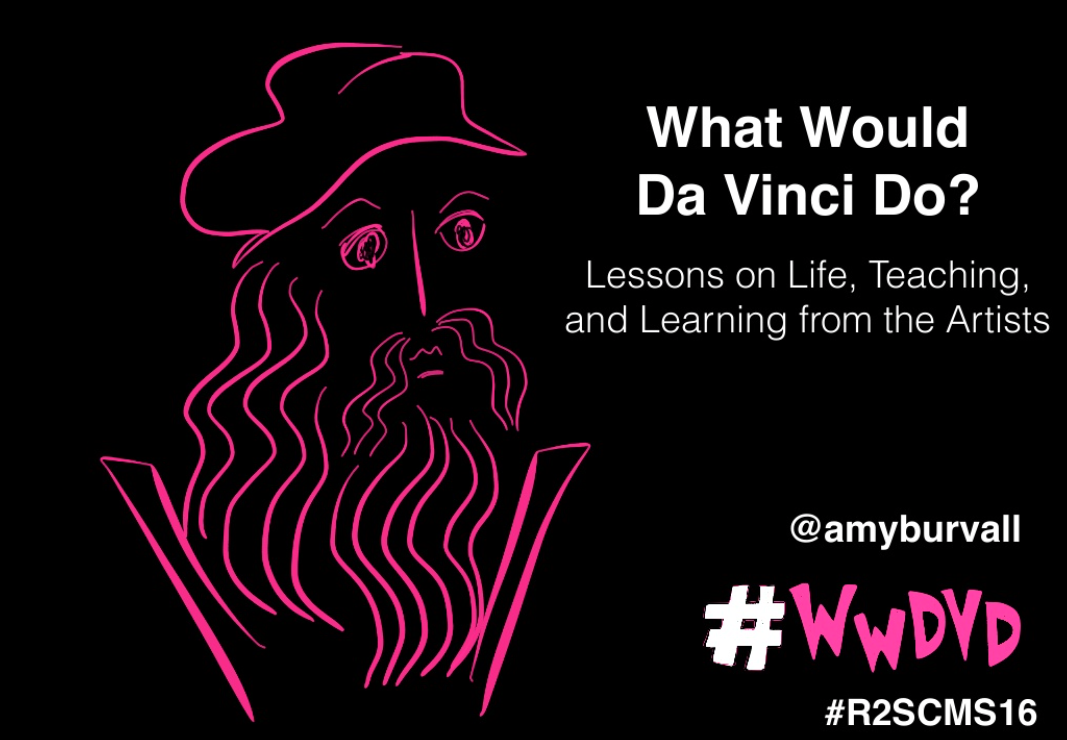
What would Davinci Do
– Visual Connectedness – although some presentations were average looking, all slides looked like they came from the same parent.
– Typography – if the fonts weren’t distinctive, they were all clear, bold and designed for impact.
– Roadmap/Arc to their Presentations – the more effective roadmap provided, the more views presentation received – some did it through absolute slide consistency, others through a paradigm/model that guided their presentation and yet others did it through numbered lists.
– Recent/Topical Experience – although some dipped into history going back 50 years for context, most of the learning was very recent and up-to-date.
– Great Examples – in the majority of cases, the presenters had curated the best examples from their own experience or more likely the “world out there” to emphasize their points.
– Quotes – a reasonable use and justifiably placed, set of quotations from famous/smart people to emphasize the point being made was a frequently used tactic.
– Asking Questions – although not uniformly used, more than half of the decks openly asked questions, either to get people to think or to lead logically to the argument being posed.
– Playful Tone – regardless of purpose of presentation (except for analysis presentations) – slide formats allowed for a bit of humour either explicitly in text or implicitly in pictures.
– Call to Action – many of the presentations had a clear call to action and what they wanted their audience to do and links to contact info.
So there you have it. Get the presentation police off your back and use whatever slide format you want by following these general guidelines. Curious to know your favourite presenter and/or presentation format?
Here are some of the best Presentation for Impact ongoing resources:
Presentation Zen http://www.presentationzen.com
Slideshare’s Blog http://blog.slideshare.net
Ethos 3 Blog http://www.ethos3.com/blog/
Make a Powerful Point http://makeapowerfulpoint.com
Duarte Blog http://blog.duarte.com
Jun 7, 2016 | Emerging Trends, Front Page, Futureproofing & Disruption, Hot Topics, New Business Models & Strategies, Product & Service Innovation, Social Innovation & Transforming Better Worlds, Technology & New Media, The Crowd, Sharing and On-Demand Economy, WHAT'S NEW
Here is the second instalment containing seven examples that point to a world that keeps getting quicker, faster and tougher to evaluate in the “Transportation” industry.
As we have seen over the last 30 years, massive disruption has hit the $4 trillion transportation industry. Detroit has shrunk into a tiny version of its former self. Air travel has continued to go through the constant boom and bust based on the economy and jet fuel prices, and has yet to collectively make a profit. The developing world can’t satiate themselves fast enough for the taste of car ownership while Western-World millennials would prefer none of it. And we all need to come to grips with increasing urban traffic congestion and its environmental effects the world over.
The difficulty in transportation is that when changes start to happen, they roll fast. And the lead times to catch up to that change can overwhelm companies, governments, societies and environments.
Here are the seven prime examples…whoosh:
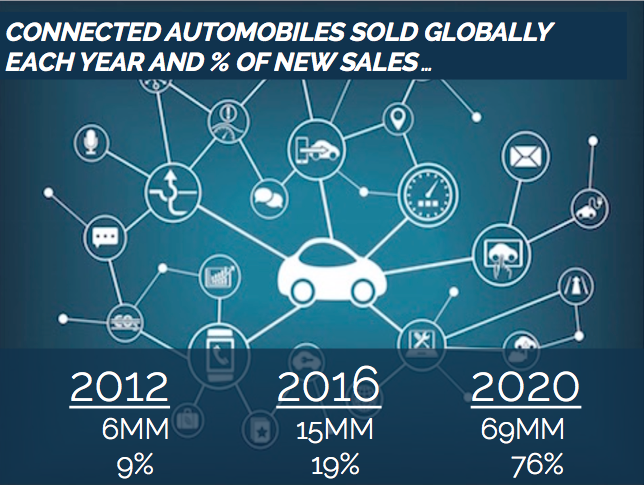
Fast Forward #7 – Connected Automobiles (2012-2020)
By 2020, we will have 11X more connected automobiles being produced each.year than just 8 years ago, making them the majority of cars produced by 2020. Since the 1908 introduction of the Ford Model T, we have now entered the fourth generation of cars – beyond: merely available; easy to use; comfortable, safety and feature-driven; to now being mobility connected. We want our cars to be extensions of our smartphones, secure environments, entertainment streams and personalized feedback mechanisms. The revolution may be coming with a roster of anticipated and unforeseen benefits.
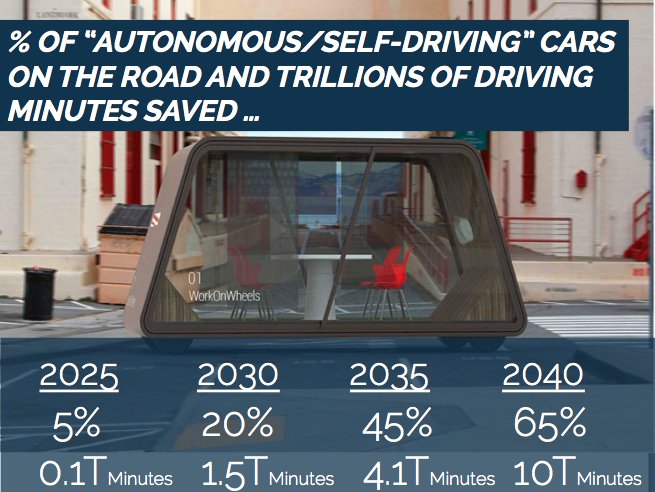
Fast Forward #8 – Autonomous/Self Driving Cars (2025-2040)
Uber was the first to jump in and introduce the first commercial autonomous (or self-driving”) car in Pittsburgh (of course they have to staff it for regulatory and legal reasons). The bigger news is that in less than a full generation, more than 65% of cars on the road will be self-driving. This will increase our amount of productive time (10 trillion minutes saved by 2040), and likely reduce our passion for gearing up on the “open road”. Think about the impacts on car design (see picture below for an IDEO concept vehicle of the future)? car ownership? on insurance? on traffic congestion? on light signals? and will truck drivers become the next secretaries, out of work due to technology shift?
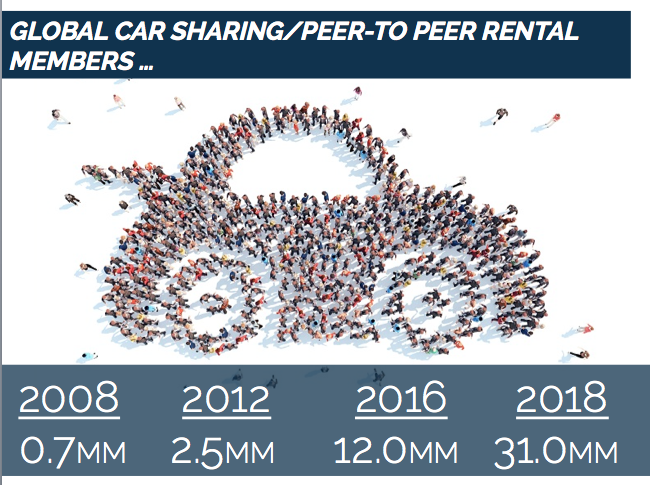
Fast Forward #9 – Global Car Sharing (2008-2018)
With the likes of CarGo, Zipcar, DriveNow and others, will the environmental, financial and lifestyle advantages of peer-to-peer car sharing make the idea of car ownership a thing of the past? Evidence – we will have 40X more car sharers in the world over the course of merely one decade by 2018
.
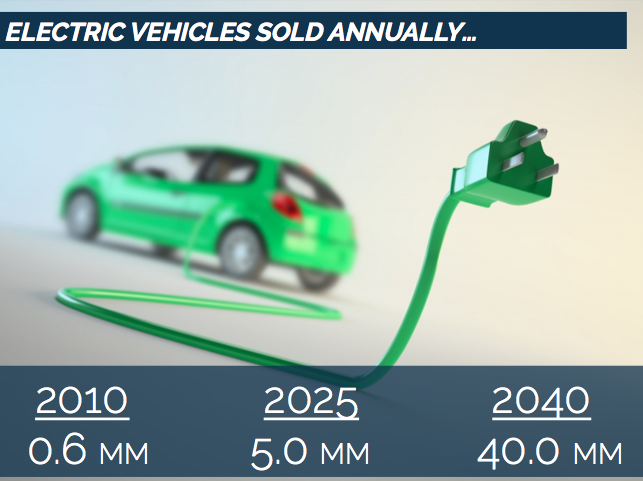
Fast Forward #10 – Electric Cars Produced Globally (2010-2040)
Perhaps this documentary was premature? Maybe we all are ready to give up the catalytic converter? Even though we have frenzied lineups for Tesla’s new electric versions, imagine a 3o year period where we’ll see a 70x jump in electric cars being produced annually and the infrastructure to support it (battery life, charging stations, electricity demand and standards) to support it.
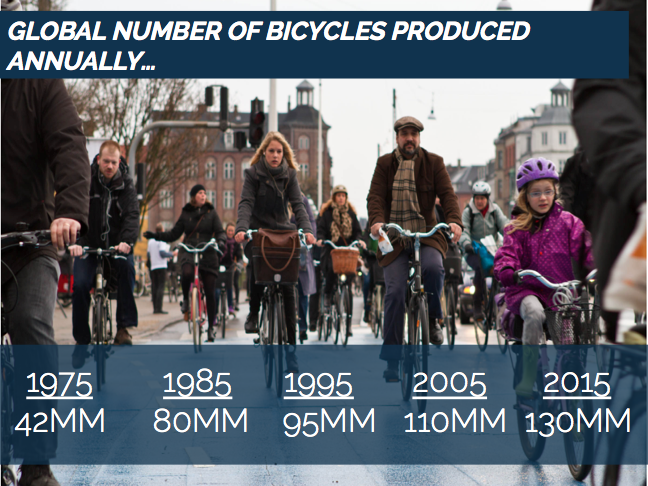
Fast Forward #11 – Global Bicycles Produced (1975-2015)
We have seen a tripling of bikes produced globally over a 40 year period. Driven by cheaper economics of bike production, increased paving, urban incentives and lifestyle preferences, it may be true H.G. Wells quote “every time I see an adult on a bicycle I no longer despair for the future of the human race”. But disturbingly, even though we can now own bikes, will we want to ride them? Even though most trips are within 5km, only 0.9% of all US trips are currently made by bike. Self-propelled, two-wheel fans and advocates, don’t despair – here are 10 countries to emulate.
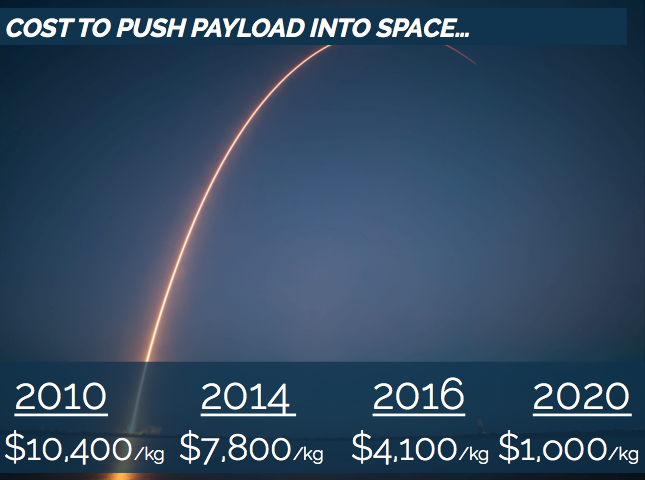
Fast Forward #12 – Cost To Push Payload Into Space (2010-2020)
For the greater part of 50 years, it has cost the same amount of money to push tonnage into space, usually exhausting tonnes of highly propulsive gas and non-reusable rockets. Given the push for Mars, need for economical satellite activity and privatized competition in the “space race”, we may be seeing space payloads that will be 10X cheaper to push into space soon and a return to mainstream excitement about space travel.
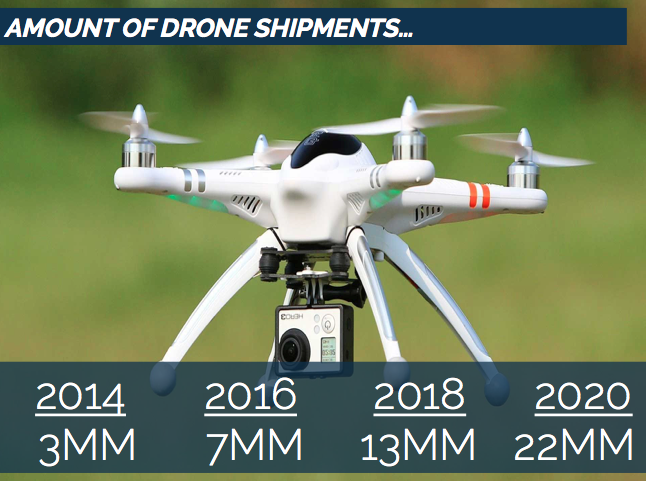
Fast Forward #13 – The Drone Industry (2014-2020)
Although Amazon Prime Air, Walmart and others have been rejected for commercialized delivery of mail and package delivery through drones, it may not be a distant pipe dream. Drones are being accepted as the next new holiday toy, but also increasingly for commercial uses. We anticipate 14X growth in annual shipments over a very short 6 year period.
Follow or link to me for more Fast Forward Updates here soon, on my website SeanMoffitt.com and a new eponymous venture launching soon.
Apr 11, 2016 | Branded Content and Social Business, Connecting with Customers, Culture & Leadership, Emerging Trends, Front Page, Marketing & Brand Engagement
In association with Wikibrands and our upcoming presentation “Personal Branding in a Snapchat Age“, we are fielding our first survey pulse check on the role of Personal Branding.
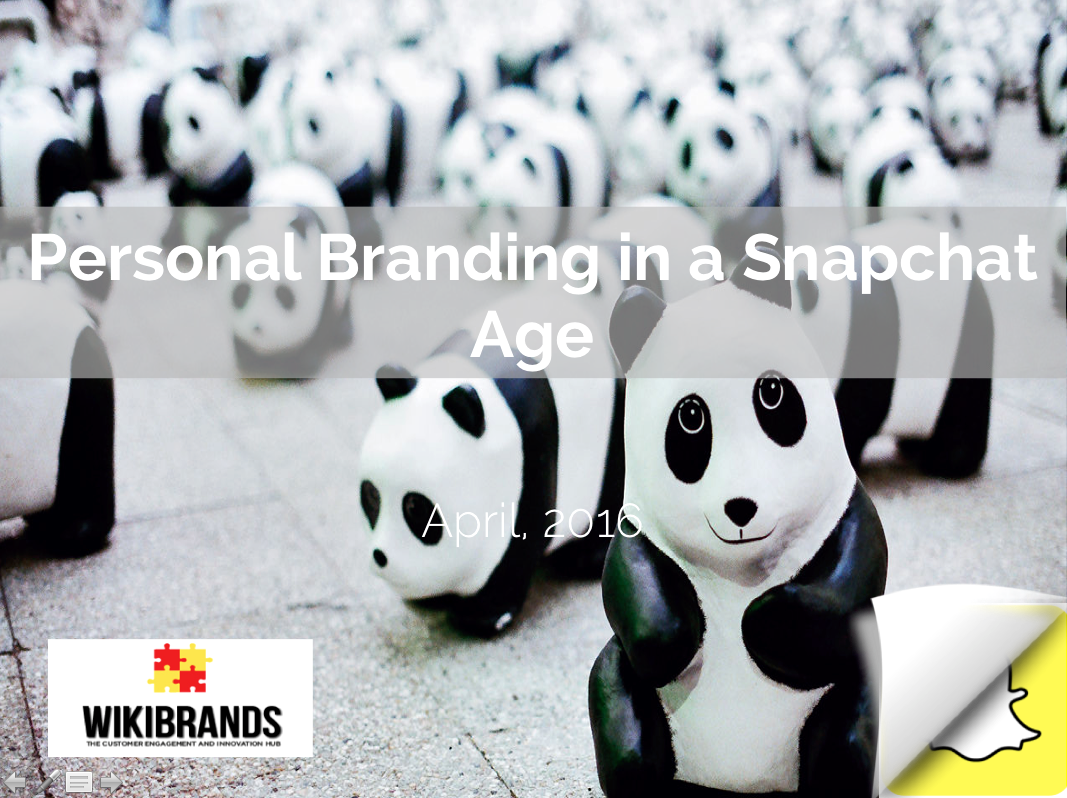
Most of my history has focused on how corporations, startups and organizations have built and incubated their brands, we’re wondering of the same rules hold for personal brands.
So in this survey, we’re asking:
- How important is personal branding? and has it increased in importance?
- Are you even comfortable with the term “Personal Branding”?
- Do employers care about the value of your personal brands?
- Are you currently happy with your own personal brand?
- Top reasons to invest in your personal brand?
- Top positions/functions that can benefit from a strong personal brand?
- Key Personal Branding Success Factors?
- Key Personal Branding Media/Content Tools?
- Top Personal Branding Social Media Platforms/Tools?
- Most frowned-upon aspects of Personal Branding?
- in your opinion, the greatest and most horrible personal brands?
- What forces will drive personal brands in the future?
- What are the best habits of great personal branders?
We’ve had some great answers already, and we’d love your thoughts. Hopefully you can grab 5-10 minutes and provide your insight. We will recognize and share toppling results with all respondents.

Additionally, if you’re considering any type of content or event around personal branding, we are expecting results finalized at the end of April’16 and would love to collaborate. Please get in touch with us here.

Mar 31, 2016 | Branded Content and Social Business, Connecting with Customers, Culture & Leadership, Customer Experience & Insights, Emerging Trends, Marketing & Brand Engagement
In a world that is all about “what happened two minutes ago”, the Olympics represent a once-every-four-year touchstone on what really has changed in the world.
Although Beijing 2008 (remember that crazy lit-up swimming pool) and London 2012 (I seem to recall sprinter Usain Bolt’s successful defence and Danny Boyle’s impressive opening ceremony) are faded memories, they are 1461-day mileposts in many sporting fields. I thought i would reprise an analysis I did back in 2012 and look at what Olympian levels of change have happened over the last 8 years in the technology track and digital field.
Sources- Internet Live Stats, Cisco, Counterpoint Stats, Statista, Facebook, Twitter, Ericsson, ATOS
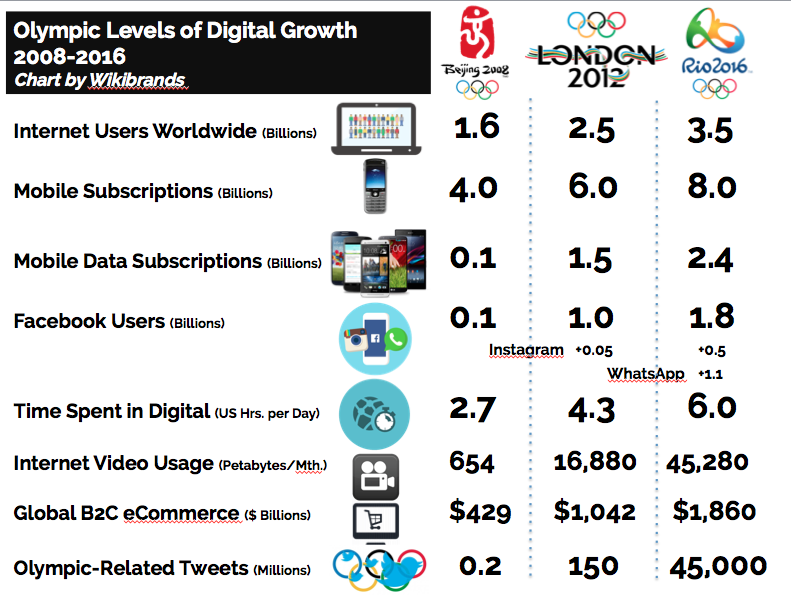
We looked at 8 different statistical weather vanes that we think best represent the state of growth in the digital universe.
- Internet Users Worldwide Growth
The growth in interest users is reaching a tipping point as they will represent close to half the world’s population (~46%) in 2016, and double what tit was 8 years ago. That’s pretty hefty given that the internet universe was a precocious 1% of the world’s population back in 1995. It will be interesting to see the trajectory of the internet and what companies focus on as internet population growth has slowed on an annual basis from 14.7% in 2008 to 7.5% in 2016. Will be still care about the developing worlds and getting the next 3-4 billion online through balloons, drones, cheaper devices and free internet? Or will we consider squeezing that juice out of the orange too hard and focus instead on enhancing the web for people already attached and drive better experiences and for companies the nirvana ARPU (average revenue per user)?
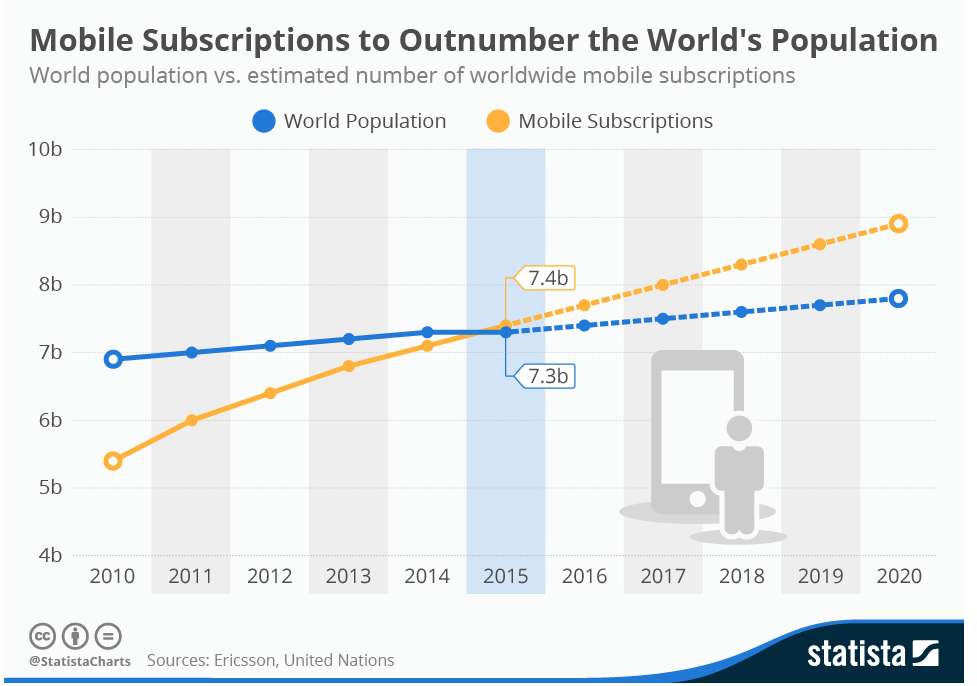
2. Mobile Subscriptions
2015 represented an interesting year for mobile in that there are now more mobile subscriptions than there are people in the world. That doesn’t mean everybody is connected, some of us have more than one way to connect (about 1.47 subscriptions per connected user). But we are reaching saturation point. The growth engine may be in connected devices. When we include the internet of Things and connected homes, cars, wearable and TVs. it is expected we will move 1 connected device per person in 2008, to 2 in 2012, to 4 in 2016 and nearly 7 in 2020.
Some interesting prospects exist in developing world nation where in places like Kenya the majority of the population owns a mobile phone to perform life’s essential services even though only 25% own a physical, real venue bank account.
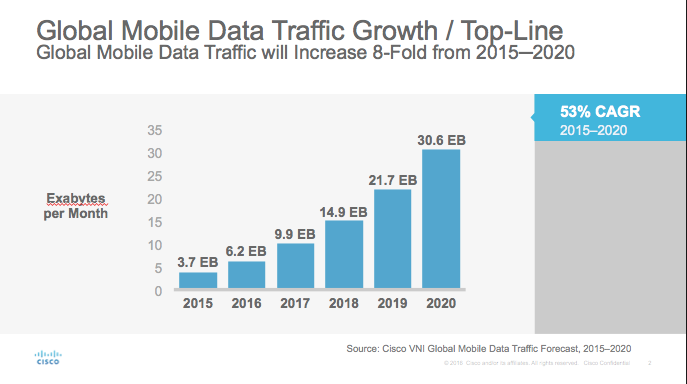
3. Mobile Data Subscriptions
Taking a global view, we have barely scratched the surface on what we can do with the smarter version of mobile – location aware, personal sensing, app-driven smartphones. Although we have experienced 24X growth over the last 8 years of more sophisticated smartphones and mobile PCs, that will be another 2.5X growth over the next 4 years. And it’s not only the number of people, but it’s also what we’re doing on our devices, enhanced need for data-rich infrastructure and our growing dependence on them.
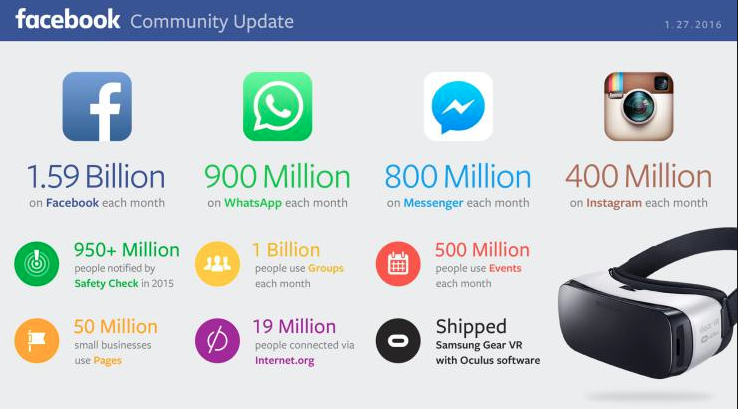
4. Facebook Users
Facebook had barely emerged from Mark Zuckerberg’s Harvard dorm room and in the shadow on ill-fated MySpace back in 2008. In fact, you couldn’t even Like things on Facebook until 2009. By summer 2016, It will have experienced 19X growth between the Beijing games and the Rio ones. It is less a social website now and more social ecosystem with flanges all over the place, competing against Google, Apple and Amazon for your life needs. And just when you thought, Facebook could lose its way and maybe become irrelevant, they decided to gobble up and grow billions of other new people and connections on platforms like Instagram which is bought in 2012 and WhatsApp in 2014, never mind it’s investment with millions of other users on a standalone FB Messenger and now Oculus Rift in 2016.
5. Time Spent in Digital
Much to family, classroom and company discord, we are slowly becoming addicted to devices. The US media consumption trend reflects the world more broadly with our inability to stay away form our screens. When watching the Olympics in Rio, we will spend 2.3X more time per day in digital media then we did while watching Beijing – that;’s about 6 hours each day!. And we will do it anywhere. Back in 2008, we spent 11% of our digital time in mobile, now we will be spending 50-60% of our digital time in mobile. Remember when addictions were smoking, gaming or sole a young people arena? Think again.
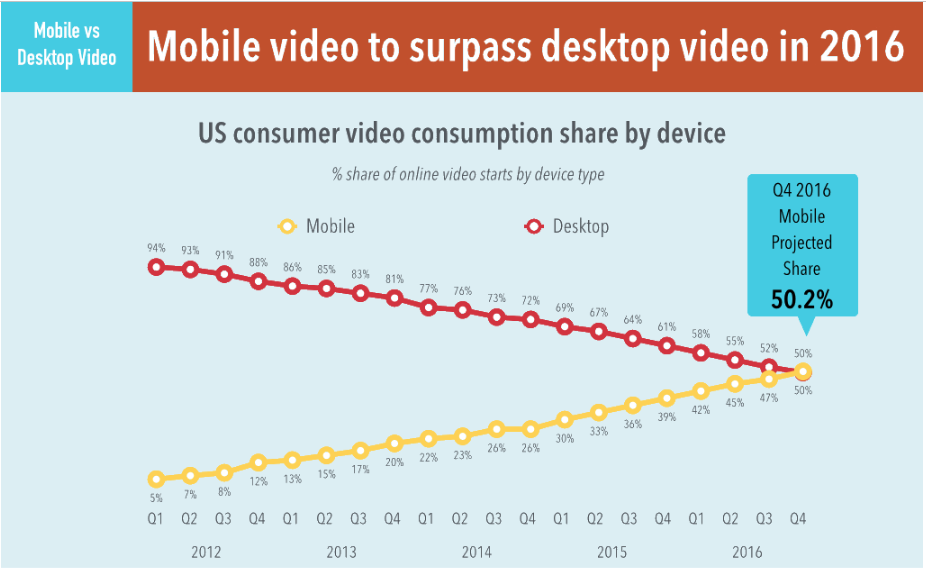
6. Video Usage
We will be watching 69X more video than we did in Beijing 8 years ago. That’s more Netflix. That’s more Facebook Video. More YouTube. More Meerkat/Periscope. And I’m sure a tonne of other niche video channels. Fully 60% of internet traffic will be video this year. And mobile video views are up a whopping 844% since 2012. the desktop is becoming less and less relevant for even the bandwidth hogger – video – in 2016.
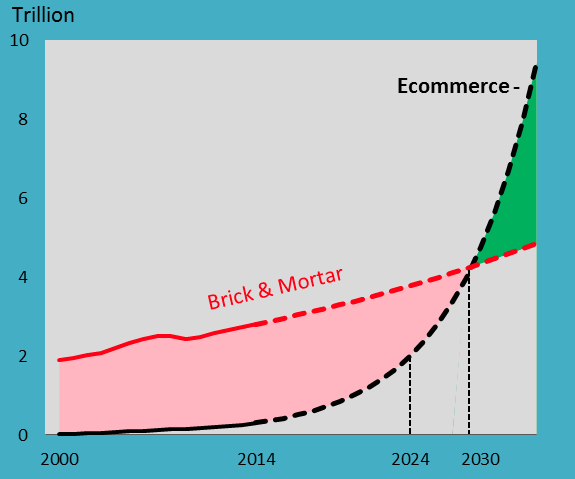
7. eCommerce/mCommerce
There is 4.3X more stuff being bought online in 2016 then 8 years ago. That may seem like a disappointment vs. other parts of the burgeoning web, but it does factor in the slower adoption of customers due to a variety of factors – preference of brick and mortar, trust/security issues, quickness of fulfillment/delivery/returns obstacles and spotty customer service. As internet commerce retailers figure this out, you will see a longer term tipping point. As US brick and mortar commerce is growing at 2.8% and internet-enabled commerce growing at 18.7% annually, we will see those two lines cross by 2030 – only 3 more Olympics away.
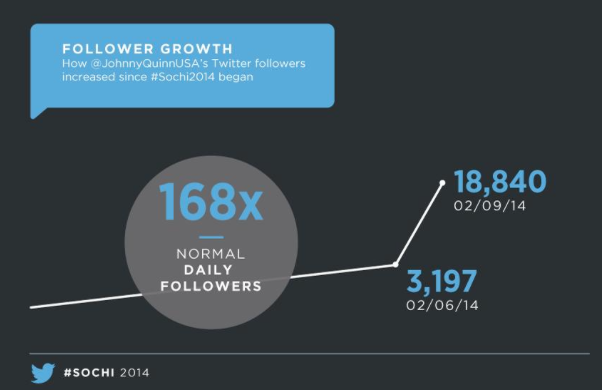
8. Olympic-Sized tweets
A full forensics on digital growth wouldn’t be complete without speaking to the amount of Tweets this summer we’ll peruse about the Rio Olympics. As much as Twitter has had its well publicized struggles on user and revenue growth, there will be 225,000X more tweets about #Rio2016 than there was about Beijing. Part of that is a function of the fact there were only 6 million users and only a handful of athletes back in 2008, 150 million in 2012 and now 350 million estimated Tweeters in 2016. Heck the hashtag wasn’t even invented until 2007! As can be seen by American bobsledder’s Johnny Quinn’s gold medal Sochi twitter performance, niche athlete can become front page headline if you play your cards and tweets right. they will all be on in 2016.